Dashboard
Overview of the ClinGEO dashboard: CAI score, trend charts, service AIV metrics, and competitors.
Dashboard
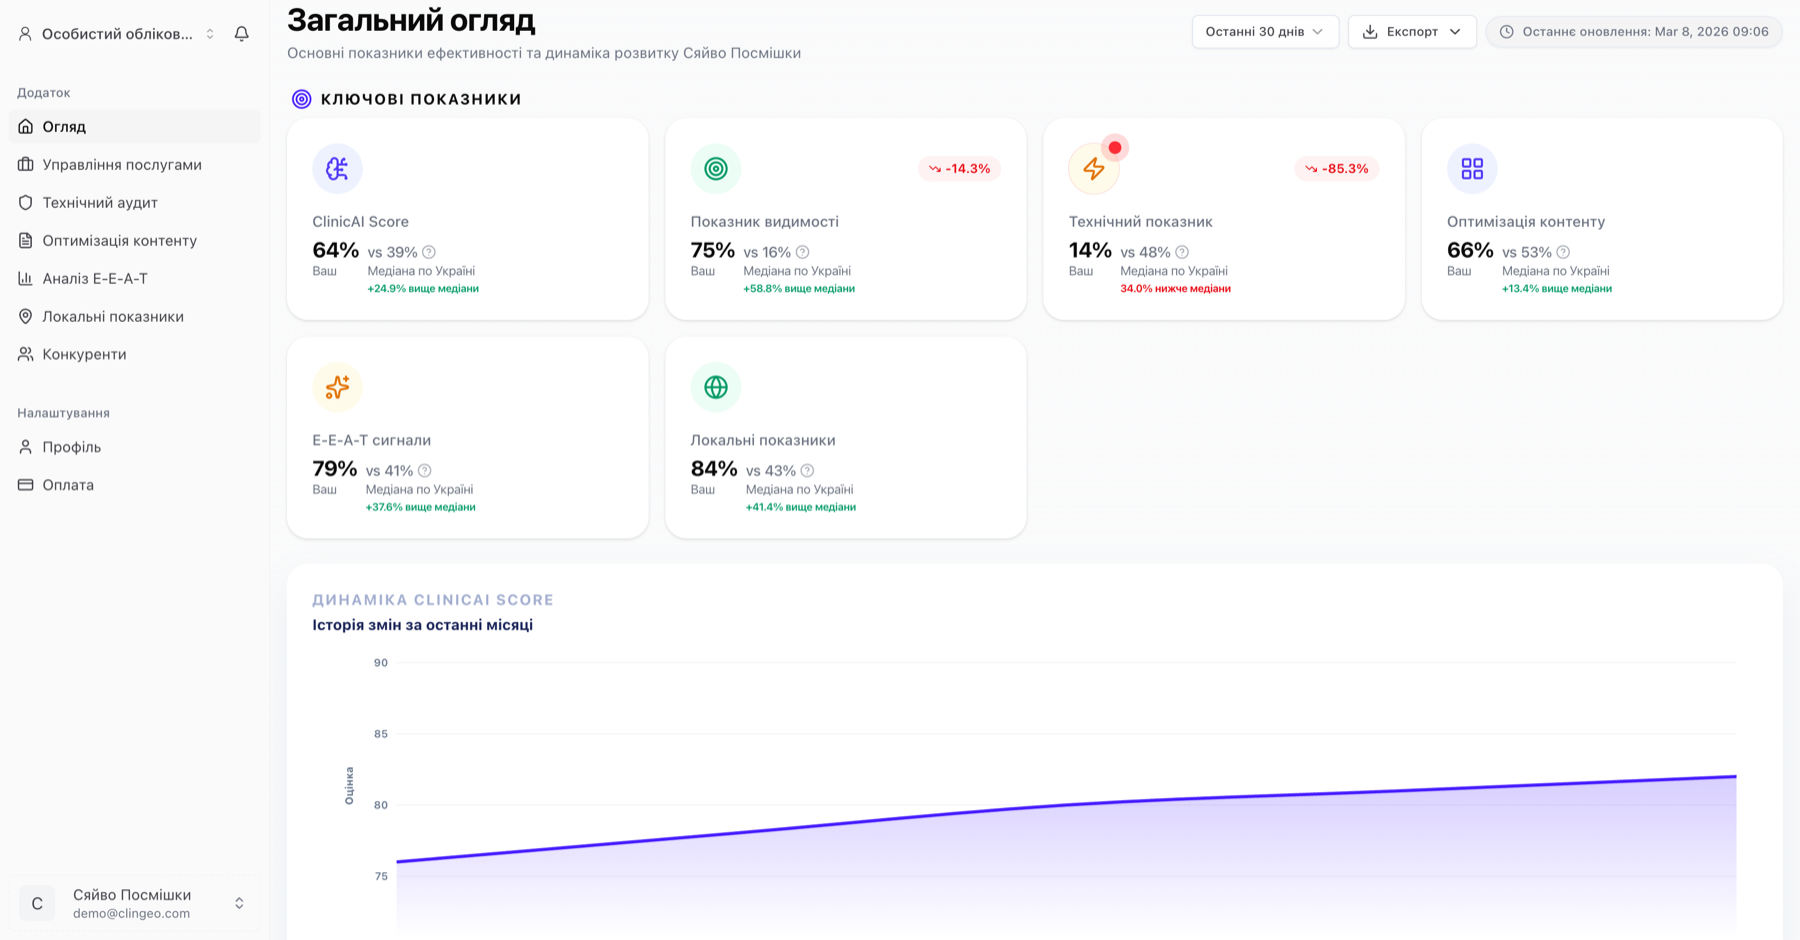
The dashboard (/home) is your central hub displaying a summary of your clinic's AI visibility. It consists of several sections.
CAI Score (Clinic AI Index)
At the top of the page you'll find your current CAI score — a composite AI visibility metric from 0 to 100.
Alongside the number you'll see:
- Trend arrow (↑ or ↓) — compared to the previous week
- Color indicator: red (0–39), yellow (40–69), green (70–100)
CAI components
Below the main number are 5 component cards:
| Card | What it shows |
|---|---|
| Visibility | % of services where AI mentions your clinic |
| Technical | Overall technical audit score |
| Content | Content optimization score |
| E-E-A-T | Trust and authority score |
| Local | Local optimization score |
Each card is clickable — click to navigate to the corresponding audit section.
CAI trend chart
Below the cards is a line chart showing CAI score dynamics over your selected period.
Switching the period
Use the buttons above the chart to select a time range:
- 1M — last month
- 3M — last 3 months
- 6M — last 6 months
- 1Y — last year
- All time — full available history
What the chart shows
The chart lets you track:
- Overall CAI dynamics
- Moments after running audits and implementing changes
- Seasonal fluctuations
Service AI Visibility
Below the chart is a table of your clinic's services with AIV metrics for each.
Table columns
| Column | Description |
|---|---|
| Service | Service name |
| AIV | AI Visibility Index (0–75) |
| Visible | Yes/No — whether your clinic appears in AI responses |
| Position | Average position in AI responses (1 = first) |
| Trend | AIV dynamics over the last week |
What AIV means
- 75 — maximum AIV, your clinic is always first in AI responses
- 50–74 — high visibility
- 25–49 — moderate visibility
- 0–24 — low visibility or absent from responses
AIV is calculated from 3 factors: appearance frequency (30%), average position (25%), and competitor comparison (20%). Maximum is 75 points.
Top Competitors
At the bottom of the dashboard is a list of competitors that AI most frequently recommends alongside your clinic.
For each competitor you'll see:
- Name and domain
- Average AIV (if data is available)
- Number of services where they appear alongside you
Click "View all" to go to the full Competitors section.
Data updates
Dashboard data updates automatically:
- CAI snapshots — daily at 00:00 UTC (automatic cron)
- Audits — every 7–14 days depending on your plan, or manually on demand
- Weekly stats chart — weekly (every Monday)
To get the most current data right now, navigate to the corresponding audit section and run it manually.